Attribution remains to be a subject of interest in the world of Search and Social Marketing. Having discussed this topic with our partners, the verdict is still out on which framework the industry should adapt when faced with this question.
Recently, the fine folks from the Google Analytics team introduced a new report called “The Customer Journey to Online Purchase”. You can find out more about their findings here.
Marketing professionals and marketing students are well aware of the marketing funnel to purchase, most usually called AIDA. AIDA is an acronym used in marketing and advertising that describes a common list of events that may occur when a consumer engages with an advertisement. A stands for Awareness (attract the customer’s attention of the product), I stands for Interest (raise consumer interest of the product) , D stands for Desire (convince the customer that they want the product) and A stands for Action (e.g. lead consumers to purchase the product). AIDA was invented by American marketer and advertiser E. St. Elmo Lewis back in 1898.
Google uses the same marketing funnel, but they call it ACID. A stands for Awareness, C stands for Consideration, I stands for Intent and D stands for Decision. The “Customer Journey to Online Purchase” attempts to match the common list of events that may occur when a consumer engages with a specific online advertisement identified by seven different sources (Display, Social, Email, Paid Search or SEM, Organic Search or SEO, Referral, Direct or Other Paid)
The Google report presents a pretty clear perspective on how a series of interactions with your brand can lead to an online purchase. We all know for a fact that it’s out there – we just need the right lens.
Google Search ads disproportianately benefit from “last click” attribution. In a typical setting, advertisers give full credit to customer purchases from Google Search and PPC Ads. While this situation gives the most obvious (if not lazy) answer to attribution, even Google acknowledges that the actual purchase is actually a byproduct of a unique “Customer Journey”. Traditional marketing describes “Customer Journey” as a series of interactions people have with a campaign through different mediums like telemarketing, Internet, branch and other forms of marketing communication. By seeing this as more of a journey, it takes into consideration the context of the customer’s feelings in each and every interaction.
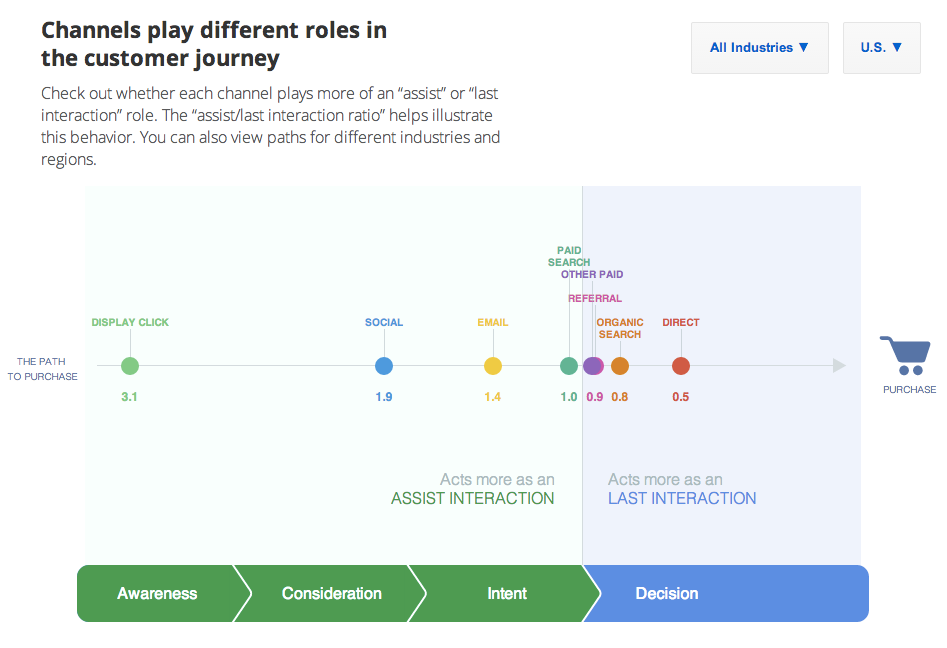
In online marketing, channels (such as email, display ads, paid search ads, social, and direct visits to your website) influence the customer at different points in the path to purchase. Now this is where it gets interesting, Google Analytics’ new “Customer Journey” tool allows a company to assign fractional attribution to each of these channels.
We’re working with two major channel types here: ASSISTING channels build awareness, consideration, and intent earlier in the customer journey or “purchase funnel. LAST INTERACTION channels act as the last point of contact prior to a purchase.
Since it’s the NBA playoff season, think of these interactions as a series of steps (from the inbound pass) culminating in an objective (scoring a basket). When Chris Bosh rebounds and passes the ball to Shane Battier who passes to Lebron James who passes to Dwayne Wade for a layup-dunk, Lebron James gets the full assist in regular statistics. If there were fractional attribution, Shane Battier might get credit for a fractional assist.
I played around with this new tool for a few minutes and I was quite impressed. For example, in the CPG industry, I found out that Social Channels are closer to the actual purchase than an Email channel. Another surprise is that in the Auto industry, Display Channels are closer to the actual purchase than Email or Social channels. It’s not really a one-size-fits-all approach. It’s up to you, as marketer or advertiser to decipher your ideal mix.
Here are the main Google findings on 11 industry groups. Every media buyer should print this and hang on their office wall.
Displayed in order from Awareness (on the left) to Decision (on the right)
1. Auto – Social, Email, Referral, Paid Search, Display, Organic Search, Other Paid, Direct -> Purchase
2. Biz – Display, Email, Social, Referral, Paid, Organic, Other Paid, Direct -> Purchase
3. Classified/Local – Social, Display, Email, Paid Search, Referral, Organic, Other Paid, Direct -> Purchase
4. CPG – Display, Email, Social, Paid Search, Organic Search, Referral, Direct, Other Paid -> Purchase
5. Edu/Gov – Social, Display, Email, Paid Search, Referral, Other Paid, Organic Search, Direct -> Purchase
6. Finance – Email, Social, Paid Search, Organic Search, Referral, Other Paid, Direct -> Purchase
7. Health – Social, Other Paid, Email, Referral, Paid Search, Display, Organic Search, Direct -> Purchase
8. Media – Display, Email, Social, Other Paid, Paid Search, Referral, Organic Search, Direct -> Purchase
9. Retail – Display, Social, Email, Referral, Other Paid, Paid Search, Organic Search, Direct -> Purchase
10. Tech – Display, Social, Email, Paid Search, Referral, Organic Search, Other Paid, Direct -> Purchase
11. Travel – Social, Email, Paid Search, Organic Search, Display, Referral, Other Paid, Direct -> Purchase
If you want to chat about how Google Analytics’ new tool of “Customer-jouney-to-online-purchase” can help in conversion rate optimization for your organization or your clients, fill out the contact form on the right.